Visual Analysis of 124 years of Olympics
Story By: Avi Arora, Sonali Pednekar, Tahera Ahmed
Introduction
The modern olympic games or more commonly known as The Olympics are the leading international sporting event. It features thousands of athletes from around the world competing in a variety of competitions.
With almost every nation competing for glory in numerous competitions, the Olympics can be expressed as a representation of how the society is functioning across the world and in different phases of time.
With its rich history, we can explore the changes in socio-economic and demographic factors across the 5 major continents.
- We propose to build a data story that connects the reader with our exploratory journey on Olympic History. Most visualizations are meant for readers to play with and get answers to questions they may have about Olympics History.
- Certain visualizations can even be used by sport managers to determine the factors contributing to a person winning a medal and thus will allow them to filter by games and have an in-depth understanding of the past games.
- We also propose building some data visualizations which might help a nation's sports administration to understand the impact of hosting on winning and also on the nation’s economic performance afterwards. This could be really helpful for nations that are thinking about hosting the Olympic games further down the road.
- The visualizations also encourage one to critically analyze how the Olympics function and how they have contributed in social-economic change.
Data
History entails 120 years of Olympic stories, to visualize it we will need to implement processing pipelines to get there. An extensive use of R and python scripts helped us reach our desired analytical dataset and produce visualizations.
Every row in our dataset (data link) has 15 associated variables that provide a description of the athlete (Name, ID) that participated in the Olympics. Distributed by competitions (event, sport) and final outcome result (Medal).
As our initial data set only contains data up till the year 2016, we will be merging the data set to a new data set that has 2021 Olympics data (data link). Keeping Athlete Names unique, a “grouped” manipulation on our data set based on different unit of analysis (Sex, Age, Height, Weight, Country) was employed.
Method
Setting up a theme for this analysis was especially kept in congruence with the Color Coding belonging to Olympic Rings. These rings represent the different continents in the world and hold the essence and meaning behind bringing the world together to participate in sports. Therefore, every color used in these plots represent the Olympic Games. While, innovation was key in each visualization proposed in this story, Figure 9 marks the official innovative view. We believe, the idea and skills implemented in Figure 9 was entirely the author's. One that cannot be found anywhere on the internet. Other figures such as Figure 2, 4, 5 & 7 contain minute yet effective innovations. To read a detailed technical report on methodology click here.
Analysis
Participation across the years
With the importance and significance of the Olympics as it is, it becomes imperative to deep dive into the participation across every nation spanning through the entire Olympic history.
The visualization below shows about the total participation of every country on the World Map. The user can click once on the map or bars to hover over the individual country to see the Country's Name and their Total Participation across the years. We note that due to the use of the current world map, it was impossible to incorporate the Soviet Union as a whole
To reveal interesting historical facts, we encourage the users to play around with this map.
We will start...The authors noticed that while hovering and clicking across USA and Russia. Either of them did not participate at all in some of the years. Upon factual checking, an interesting revelation was made.
In 1980, due to the Cold War, United States of America did not participate in the Olympic Games because of the current Host, Moscow,Soviet Union. In protest, Russia skipped the 1984 Olympics, hosted by United States of America in Los Angeles.
Olympic History, reinstates social injustices such as Racism. In 1964, South Africa was prevented from participating in the Tokyo Games for its Apartheid regime. That ban lasted nearly 30 years. Clicking and hovering on African participation, there is missing participation from 1960-1996.
World Wars impacted the Olympics which is reflected in its history. In 1920, 1924,and 1948 Germany was disqualified from the Olympic Games due its involvement in World War I, while Japan was disqualified in 1948 from participating due to its involvement in World War II.
Top 10 performing countries
Idea: In this spirit of Olympics, participation shows how the world comes together to enjoy sportsmanship. One of the more exciting aspects is the end result. A visual attempt to see how countries perform during the Olympics is made to summarize this enthralling experience.
The top 10 countries that have showcased exceptional victories are the United States, China, Germany, United Kingdom, Italy, Russia, Sweden, France, Japan, and Australia.
The United States has ranked the topmost with a landslide with approximately 3000 medals in its name. Following the United States is the United Kingdom, Germany and France with 948, 892 and 874 medals in total. Other countries have medals ranging from 700-555.
The United States also has shown to have the most Gold, Silver and Bronze medals. Japan and Australia are the lower spectrum of this analysis and it shows that while Japan has a lesser number of medals overall, it has more number of Gold medals than Australia. Australia on the other hand has more bronze medals.
Hosting Olympic games
Countries across the world spend millions of money to train their athletes, build their infrastructure and many things pertaining to the Olympics. All of this just to win medals and bring home the glory. So, it is worth analyzing what are factors on a macro as well as micro level that could help a country win.
Whenever we talk about a sports team winning, the first question that pops in our head is if they were playing at home. Home Away advantages are such a big thing in sports that Champions League has two legs in every eliminator, on Home and one Away, just to balance out the advantage. So, obviously this becomes our first focus of analysis. We check if there is any advantage in hosting the Olympic games in terms of the number of medals won. Hosting obviously involves more administrative costs. So, it makes the problem two fold: Competitive edge and Financial.
Competitive Edge while Hosting
To check if the host nations perform better in the Olympics, top 10 most performing countries of all times have been chosen. This helps us analyze what was the performance of these countries when they hosted the Olympics or when they were visitors.
A first glance at the graph confirms our hypothesis. The purple points representing the times a specific country hosted Olympics seems mostly on the right side depicting more medals. This is in sync with our knowledge of other sporting competitions.
Glad to know sports follow a general rule :)
The right most point on our graph for the USA with 239 medals were the 3rd Olympic Games held in St. Louis, Missouri and holds the record for most number of medals in a year by a country.
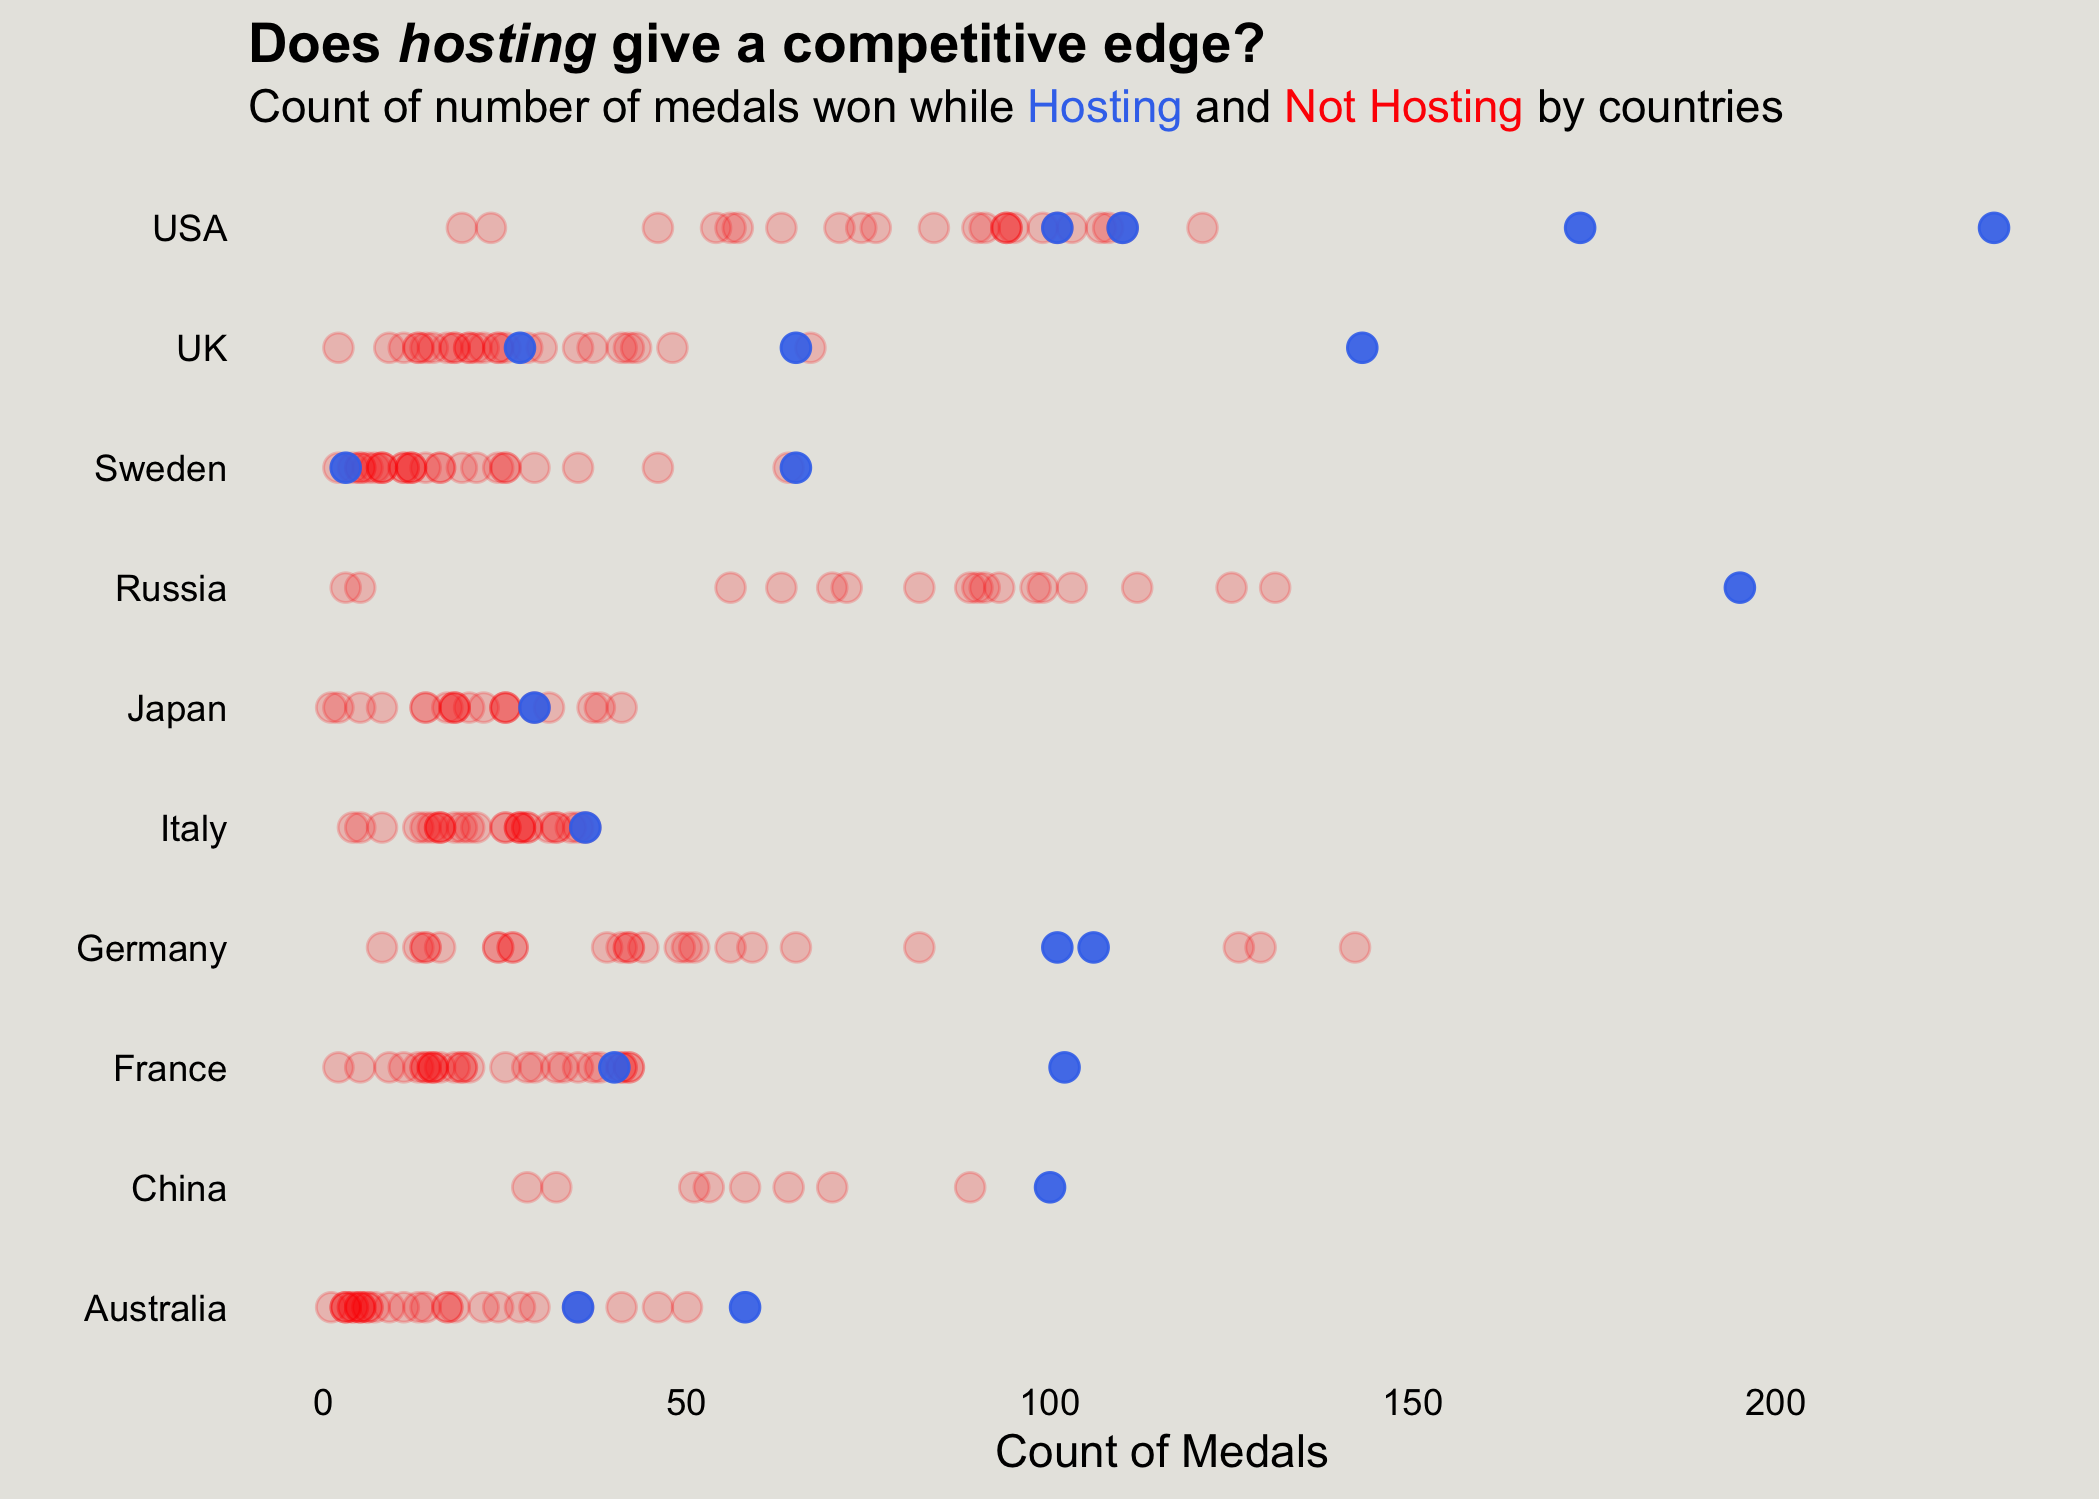
Even after 120 years of Olympics, the record is yet to be broken. This could be because of the increasing competitiveness and infrastructure for other countries. Factually speaking, the 1904 games were hardly an international affair. European nations balked at the cost and slow speed of travel to St. Louis, and when the games finally kicked off, only 12 countries bothered to show up. Americans accounted for 523 of the 630 total athletes, and more than half of the events were contested entirely by homegrown competitors. Thanks to the significant numerical advantage, the United States would go on to win a total of 239 medals—the largest ever haul in a single Olympics.
Financial Implications while Hosting
While, host countries have shown to perform better than other countries in an Olympic Game. Another aspect to be explored is the financial implications of hosting the Olympics.
Cities typically spend $50 million to $100 million in fees for consultants, event organizers, and travel related to hosting duties. For example, Tokyo lost approximately $150 million on its bid for the 2016 Olympics and spent approximately $75 million on its successful 2020 bid.
With a whopping sum like that, it is important to look at whether money is recovered in the future.
Initially, the project focused on whether hosting Olympics can affect GDP growth. However, this approach was dropped as GDP is calculated from the returns of a larger group of sectors and its growth cannot be simply compared to one sector alone, in our case, Sports. In order to make such a comparison, it is necessary to dwell into the details of GDP and Olympics, which this project does not intend to. Therefore, a different approach has been employed to make a financial analysis. In our case, a decision is made to see if Hosting Olympics can help generate more tourists in the country and thus increase a country’s revenue.
Analysis: The analysis shows that for each country that has hosted (United States 1996, Australia 2000, Greece 2004, China 2008, United Kingdom 2012, Brazil 2016, Japan 2020), there has been a slight increase in the arrival of tourists in the country. There has not been an overwhelming increase in this population. The only country that has seen a decline is China in 2008. This could be a link to the Economic Crisis of 2008. The sharp decrease in tourists during the 2020 Tokyo Olympics can indicate the impact of the spread of Covid-19 across the world. However, these are all assumptions not proven facts. These plots hold a cardinal importance in one's understanding of Hosting the Olympics. Not only does this helps us analyze what was the performance of these countries when they hosted the Olympics or when they were visitors. At the same time, helps nations truly understand the implications of hosting.
Physical and social factors
Gender
Gender gap has been a prevalent feature of society for a very long time. Be it in the workplace, pay gap, education or medicine.It is natural that this inequality will have an effect on the distribution of participation in Olympics. The graph below describes the distribution of male and female participants and the total participation throughout the history of the Olympics. Through this graph, we can study if the gender gap still exists.
The first ever Olympics (1896) hosted had only male participants. It has been a long road since the start of the Olympics, when the first female participation was recorded in the 1900 Olympics.
Even then compared to the male participants the number of female participants was very low. There was a slow and steady increase in female participation every year but still the participation on the male front was very high.
The female participation started soaring after the 1984 Los Angeles Olympics when multiple new events were introduced/ opened for females. The International Olympic Committee (IOC) has been actively promoting the advancement of gender equality in and through sport across the Olympic Movement and beyond since the 1900s. In 1991, the IOC made it mandatory for all new sports applying for Olympic recognition to have female competitors.
The gender parity is finally closing in by the Tokyo 2020 Olympics where it can be seen that the number of participants in both the genders is almost the same.
Moreover some additional trends are also evident from the above graph. There are some dips in the participation throughout history. Let’s deep dive into the reason behind the fall of participation.
1. 1904 : Only a few countries participated in the 1904 St. Louis Olympics. This was due to the difficulty of getting to St. Louis in 1904, and European tensions caused by the Russo-Japanese War, only 62 athletes from outside North America participated in the Olympics.
2. 1932 : The poor participation was the result of the worldwide economic depression and the expense of traveling to California.
3. 1956 : Eight teams boycotted the Games for political reasons
4. 1980 : 66 nations, including the U.S., boycotted the Games in response to the Soviet invasion of Afghanistan.
5. 2020 : The latest decrease in participation was due to Covid.
Image : Link
Gender Parity in Tokyo 2020 Olympics
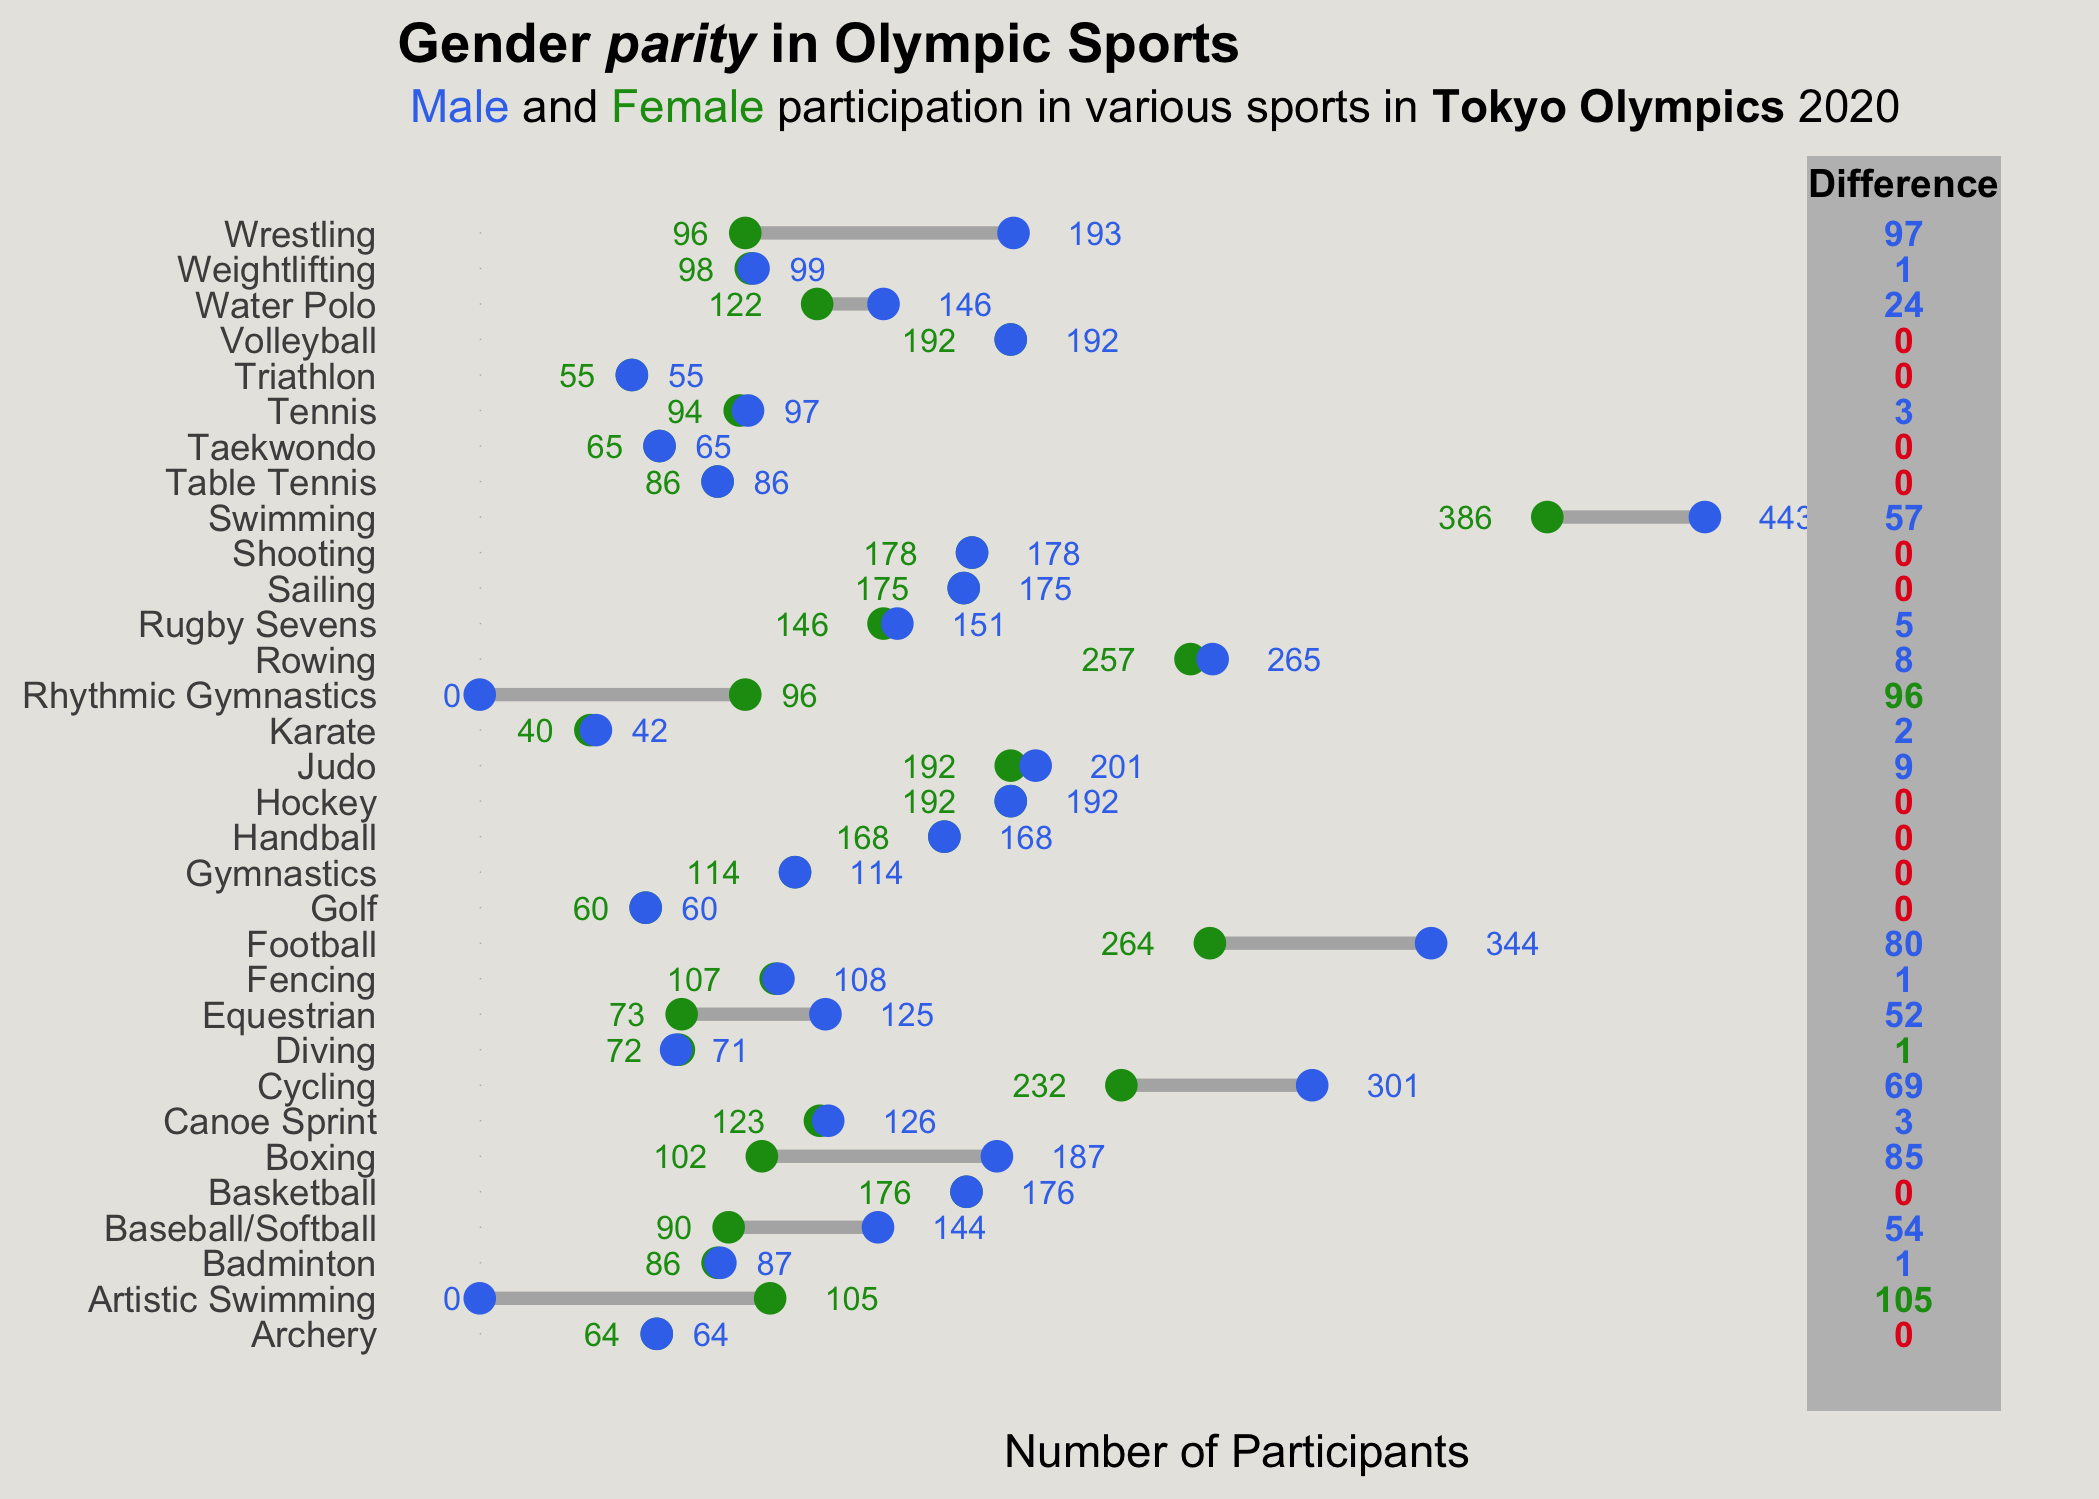
More than a century after women started competing in the Olympics, female participants were almost equal to their male counterparts in the Tokyo 2020 Olympics. This distinction in the history of the Olympics is celebrated in the next visual which depicts the participation of athletes in each sport in the Tokyo 2020 Olympics. Some of the sports are excluded from the graphs as their participation is low. Athletics is excluded from the graph as the number of participants is high.
Although there is some comparative decrease in the total number of participants from the previous years due to Covid, there are some valuable insights that can be gained from this plot. There are a lot of sports where there is no difference (denoted in red) between the male and female participation. This is a huge progress from the start of the Olympics. There were two women centric sports hosted in the 2020 Olympics : Artistic Swimming and Rhythmic Gymnastics. The inclusion of these sports dates back to the 1984 Olympics after which the female participation boomed. There are still some sports with male domination but the IOC has made a commitment to reach full gender equality for the Olympic Games Paris 2024.
Age and Bmi
Talking about sporting events will always be incomplete if we don't discuss the age, weight and height of the athletes participating. Weight and Height can be represented as one entity that is BMI.
In terms of different sporting events, BMI plays a very important role. Theoretically, BMI for a sport where more force is required should be higher from the one where more agility is needed.
The importance of BMI however does not weigh down the analysis of age.
Question: Is exuberance of youth more relevant or is experience the most important thing in a world level event?
With more than 40 sports existing in the Olympics, it will be a nightmare for Sporting directors and analysts to answer all these questions and scout top athletes in terms of desired age and BMI for every sport. Therefore it becomes necessary to have some basic knowledge of the average age and BMI of all the athletes over history for different sporting events. Now obviously for this big jigsaw puzzle called Sports, a key of Age and BMI is not going to be enough. However, it still narrows down the search from millions of people to the ones fitting these visual points.
Fig.7 - Age and BMI plot
The plot above showcases the comparison of Age to BMI across all the sports in both Males and Females in a comparative sense. In general, the BMI of females is lower than males which makes logical sense. The lowest average BMI however is close to 17 which is very low in comparison to other sports. We talked before how Rhythmic Gymnastics is a female centric sport and now we know that on average the participants in this sport are barely 18. This means that this is a sport for young females with a low BMI. On the other note, other Gymnastic sports also seem to be having a lower mean age and BMI. The highest BMI is in weightlifting which is in accordance with the theory we mentioned beforehand. One interesting data point is of Art Competitions. This event has a mean age of 46 years and is the only sport with an average age over 35 years. This sport is not a part of the Olympics anymore and was prevalent before 1948. Some sports like Shooting and Equestrianism seem to be for experienced athletes as the mean age is high for them. However, Boxing, Swimming, Gymnastics and Triathlon seem to be a sport where youth is preferred.
Image : Link
Most Successfull Athletes Now that we have seen the Olympics from a broader perspective. We felt the need to dwell further and ask new questions. As we celebrate not just the Olympics, but also the driven athletes that work for 4 years to finally prove their efforts and worth in the Olympics. It was essential for us to shed light on these athletes. In order to find more about top performing athletes an initiative was made to visualize their performance. This performance will be measured across all the years and all the number of games they have participated in.
Fig.8 - Successfull Olympians
The analysis shows two players that have had a winning rate of more than 90%. They are Michael Phelps (Swimming, USA) and Larysa Semenivna (Gymnast, Soviet Union). Michael Phelps has a whopping 28 medals out of the 30 games he has played. While Larysa participated in fewer games she has lost only 1 of the games. With 70% of the times games won, Competitive Swimmer Jennifer Elisabeth has 8 models in her name.Other notable Olympians are also annotated. Their names can be revealed through hovering on the plots. The analysis also shows that there are certain Olympians who have participated in a great deal of games, but have won seldomly. Most participation and wins are seen by European countries followed by Asian countries.
Domination of Micheal Phelps
The previous plot showed us the most successful athletes of all time. It goes without saying that anyone who wins a medal in the Olympics, even a single one, is a great athlete. Nevertheless, there is one athlete that has defied the law of averages and has a win ratio of more than 90% at Olympics as seen above. Such a terrific performance in a high pressure world class event like the Olympics definitely deserves a specific analysis.
In the following plot we visualize the number of medals by every country from when Micheal Phelps started participating in the Olympics.
So, it is just a plot of the medal count of countries from the 2004 to 2016 Olympics. How is that gonna be of any help, you wonder. Well, the plot has a very special twist as Micheal Phelps in itself has been treated as a country :p
This plot marks our official Innovative view as in addition to the twist of keeping Micheal Phelps as a country, a simple bar chart has been changed to an animated plot.
For this plot, the graph panel enacts as the bottom of the swimming pool as a tribute to Micheal Phelps. The total number of medals is reached by swimming across the entire pool which marks the number of medals starting from 0 to the maximum number of medals.
Since in the same time (in reality years 2004-2016), the swimmer for USA swims the most, they have the most number of medals which is represented by the number at which the swimmer stops in the end.
The plot only accounts for the number of gold medals won by a country as they are the most important elements in terms of ranking of countries in the Olympics.
Micheal Phelps as a country ranks 14th in terms of the most Gold Medals won and ends up above some big names like Spain and Jamaica.
For reference, the number of countries that participated during this timeline were 207. Micheal Phelps, in fact, has a better record than 67% of countries which would be more than 90% of the world population.
Good Job Micheal!
Critical Analysis of the Ranking System
While analyzing how great Micheal Phelps is, we got struck by a very important aspect in the Olympics : The Ranking System. We saw that in terms of the current ranking system, Micheal Phelps ranked 14th across all countries. However, a further deep dive suggests that in terms of the total medals won, Micheal Phelps ranked 34th across all countries which accounts for a rank jump of 20 places. Frankly, while we were making our analysis, these 20 countries out there were getting furious. Calm down, we have got you sorted. Right now, the common method of determining the success of countries at the Olympic Games is a ranking order based first on the number of gold medals won, then silver and bronze. This method is vastly used by the IOC. As per the current ranking system the importance of gold medals is such that if a country has won 1 Gold medal, its rank will be higher than a country that has won 40 total medals but none of them is gold. This seems pretty unfair doesn't it. However, the ranking system widely used by the IOC and all the media houses can't be that unfair. This sets up the basis for our next analytic question.
Fig.10 - New Ranking System
Looking at the graph, we can say that there is not much separating both ranks in terms of frequency of wrong rank given. Majority of the original and calculated rank points coincide with each other. Therefore, statistically it is safe to say that the ranking system somewhat performs similarly to our notions, even if it doesn't make mathematical sense. Now, this is THE Olympics. Statistics doesn't get you results here. A difference in one rank is a big difference here. We are quite certain that the US team from 2008 doesn't agree much with our statistical sense of the graph where they outperformed China by a whopping 13 total medals and were still ranked 2nd in the Olympics. Bottomline is, we believe that the IOC would be better off where a weighted medal approach is taken in order to credit every medal winner in a weighted sense.
Conclusions
This brings us to the end of our beautiful and insightful journey. Olympic History was able to bring together athletes in spirit, social injustices in facts, social change in participation, and financial impact in hosting. The different visualizations used, focused on different topics, such as financial, social aspects, celebrating athlete success.
Interesting facts were revealed, exciting information was imparted and we worked together to make new findings. Our own Olympic event of unification and coming together if we may say so!
Image : Link